Bank Of India CONSERVATIVE HYBRID FUND
-
Fund Type : An Open Ended Hybrid Scheme investing predominantly in debt instrumentsEntry Load : NilDate of Allotment : March 18, 2009
-
Benchmark :CRISIL Hybrid 85 + 15 - Conservative IndexExit Load :
Investment Objective
The Scheme seeks to generate regular income through investments in fixed income securities and also to generate long term capital appreciation by investing a portion in equity and equity related instruments. However, there can be no assurance that the income can be generated, regular or otherwise, or the investment objectives of the Scheme will be realized.
Fund Manager
-
Alok Singh
CFA and PGDBA from ICFAI Business School.
 See detail
Around 20 years of experience, including 16 years in mutual fund industry.
He is managing this fund since May 21, 2012.
Fund Highlights
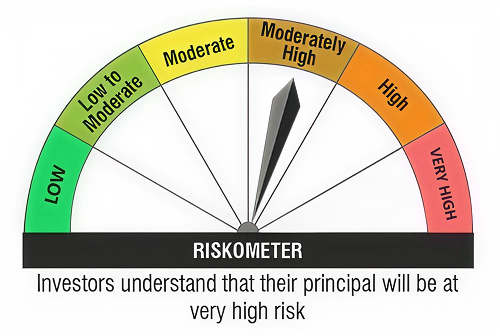
Riskometer
Scheme Riskometer:

The above Riskometer is based on the portfolio as on 30th April, 2026.
This product is suitable for investors who are seeking*:
- Long term capital appreciation and regular income.
- Investment in equity and equity related securities (10% - 25%) as well as fixed income securities (Debt / Money Market Instruments / Govt. Securities).
Benchmark Riskometer : CRISIL Hybrid 85+15 - Conservative Index:
*Investor should consult their financial advisor if in doubt about whether the product is suitable for them
The above Benchmark Riskometer is based on the portfolio as on 30th April, 2026.
Top 10 Portfolio Holdings
Credit Profile
Asset Allocation
Fund Performance
- Scheme
- Benchmark
Performance(Regular Plan - Growth Option & Direct Plan - Growth Option)
| Current Value of Standard Investment of Rs 10000 in the | |||||||
|---|---|---|---|---|---|---|---|
| Date | NAV Per Unit(Rs.) | Scheme Returns(%)^ | Benchmark Returns #(%) | Additional Benchmark Returns # #(%) | Scheme (Rs) | Benchmark #(Rs) | Additional Benchmark # # (Rs) |
| 1 yrs | 33.0580 | 3.02 % | 2.66 % | 2.11 % | 10302 | 10266 | 10211 |
| 3 yrs | 27.9563 | 6.79 % | 7.80 % | 6.79 % | 12182 | 12530 | 12180 |
| 5 yrs | 21.3428 | 9.79 % | 6.70 % | 4.95 % | 15957 | 13835 | 12734 |
| 10 yrs | 17.1502 | 7.10 % | 8.30 % | 6.05 % | 19858 | 22207 | 18007 |
| Since inception | 10.0000 | 7.45 % | 8.83 % | 5.81 % | 34057 | 42288 | 26208 |
IDCW History(Regular Plan- Annual IDCW)
| Record Date | IDCW (`/Unit) |
| 02-Feb-2021 | 0.23090000 |
| 02-Feb-2021 | 0.23090000 |
| 30-June-2021 | 0.30000000 |
| 30-June-2021 | 0.30000000 |
| CLICK HERE TO VIEW THE IDCW HISTORY |